
Composition of house dust or building dust:
This article describes the common as well as less-common constituents of house dust and typical office building dust. We also cite the occurrence of particles that may indicate indoor air quality concerns, hazardous conditions, or other building conditions that may be detected or perhaps simply suggested by the presence of certain particles in air, in settled building dust, or in vacuum-cleaner collected or clothes dryer-collected dust and lint.
We also provide a MASTER INDEX to this topic, or you can try the page top or bottom SEARCH BOX as a quick way to find information you need.
What are the Contents of House Dust & Office Building Dust
Typical components of house dust and typical office building dust are dominated by fabric fibers and skin cells. Common too are lower levels of dust mite fecals, insect fragments, and air-delivered pollen and mold, though the levels of these varies seasonally and by changes in the indoor environment such as in humidity.
Watch out: usually the dominant constituents of house dust (fabric fibers, skin cells) do not pose a health hazard to humans.
However studies that we will cite here also have confirmed that in some buildings house dust may also include dust particles that carry potentially harmful carcinogens, endocrine disruptors, or that cause other illnesses or disorders.
See MOLD / ENVIRONMENTAL EXPERT, HIRE ? for help in deciding if it’s appropriate to bring in a professional to assess indoor health risks.
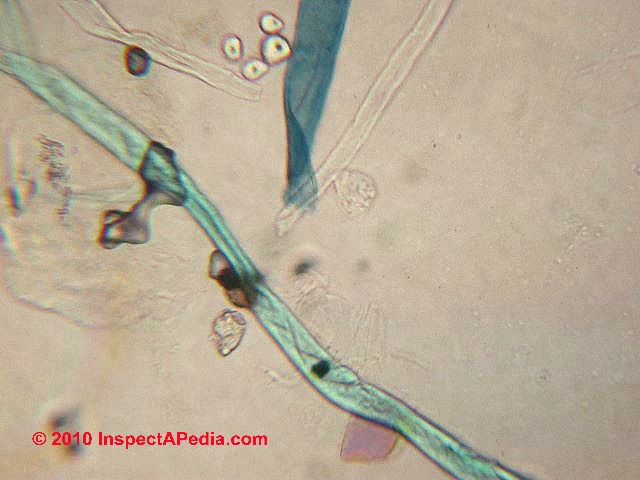
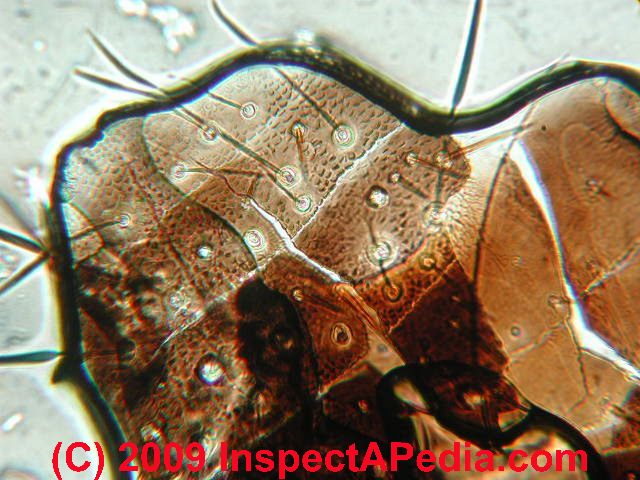
Our photo shown above illustrates house dust containing fabric fibers, starch granules (upper center), skin cells (left), and probable soil-particles.
In a wet building skin cells and animal dander may also show secondary bacterial growth.
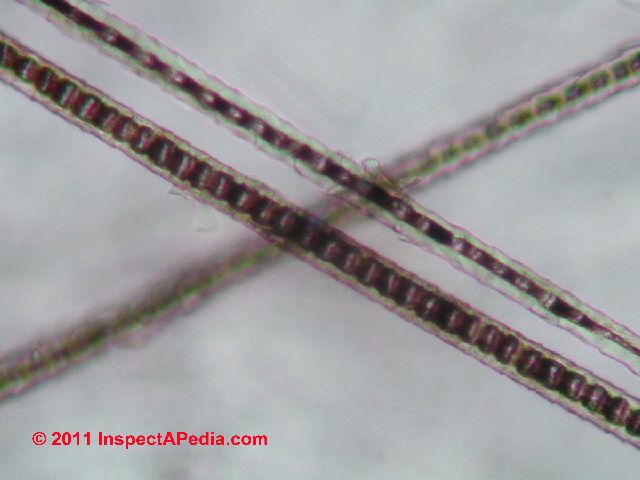
Below is an example of animal hair (cat) commonly found indoors. Even in homes where no pets are currently living, and often in homes where no pet has ever (been reported to have) lived we may find cat dander and on occasion dog dander and mouse dander.
Normal Levels of House Dust

Cat allergens (cat dander) are common and are often more allergenic to building occupants (ALLERGENS in BUILDINGS) than dog dander or animal hair in general.
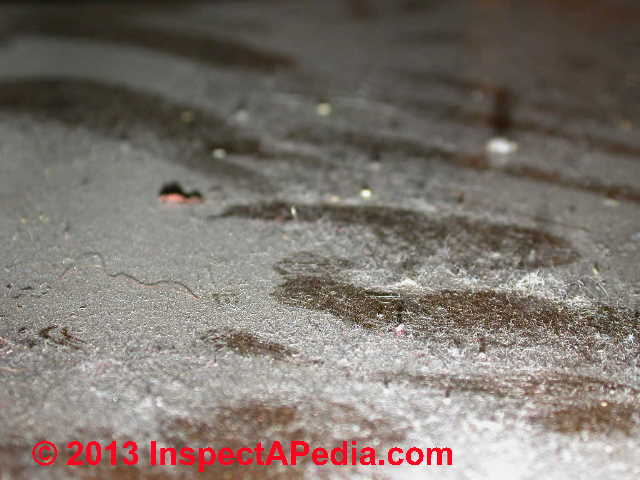
Our page top photo of typical “dust bunnies” that collect on building floors below furniture and under radiators, and our photo of a dusty table top (just above) are fairly normal of an indoor building prior to typical housecleaning vacuuming and dusting operations.
Watch out: dust is a common and normal material found in almost all buildings.
Do not seek an objective of “no indoor dust” in a normal building: doing so wastes money and time and is not rational. Only in controlled environments such as computer chip manufacturing lines do we expect to find few airborne particles.
Abnormal Levels of House Dust May Not be Acceptable
But abnormal levels of certain particles in building air or dust can indeed indicate an indoor air quality or indoor environmental problem that needs to be addressed.
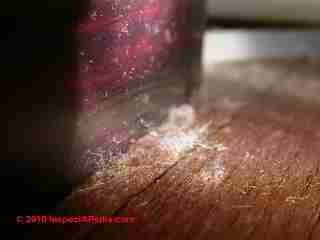
Our photo at left shows a very dusty indoor surface characteristic of poor housekeeping.
Even if this dust contains only typical house dust components the dust level is likely to be irritating to some people (including the author) who are asthmatic or have allergies.
So how do we decide between just cleaning up obvious dust and debris indoors and the need to hire a building expert to look for hidden contaminants and if found to write a building remediation plan?
At MOLD / ENVIRONMENTAL EXPERT, HIRE ? we give a rational to help decide when further investigation of the indoor environment appears warranted.
Abnormal Indoor Particles Can Indicate Indoor Air Quality Problems or Health Hazards
We may however find either higher levels of common problem particles (allergens, insect fragments, mold, fiberglass or other insulation fragments) or low levels of particles that by their nature (such as Aspergillus sp. mold spores in chains) still indicate a problem.
Or we may find abnormal and possibly harmful levels of asbestos, concrete or silica, small fiberglass fragments, lead dust, mold at high levels, oil burner or fireplace soot, or non-particulate hazards such as gases or chemicals that are not addressed here.
Our photo at above left illustrates a dust mite head fragment.

Above is a cockroach insect jaw fragment. More often we see insect hairs, wing fragments, and fecal pellets.
While dust mite fecals are common in house dust, higher levels of actual insect fragments may indicate higher indoor humidity, or the presence of extra levels of mite sources (animals, animal dander, poor housekeeping).
See HUMIDITY CONTROL & TARGETS INDOORS.)
Fergusson et al (1986) point out that heavy metals may also be present in dust samples.
Also see LEAD POISONING HAZARDS GUIDE)
Still other biological hazards can be present such as bacteria and viruses. And particularly for buildings near highways, active streets, construction or demolition projects, tire particles, road dust, and CONCRETE DUST & ODORS can be significant ingredients in indoor air and in building or house dust.
All of these may appear at harmless, harmful, or suggestive levels in building dust or other indoor environmental samples.
In addition to our example data and photographs, this article includes citations to authoritative research on the components of house dust, building dust, vacuum-cleaner dust, and clothes dryer dust.
At above left we illustrate a microscopic close-up of dog hair, in this case from a golden retriever.

The photo above illustrates a mix of skin cells (larger fragments) and dog dander heavily stained with acid fuchsin. Normally these particles are hyaline (colorless).
Examining animal hair samples in a building may be diagnostic for a different reason. Above: chinchilla hair.
We may find examples of mouse or rat hair at levels suggesting a rodent infestation problem. In some areas rodent infestation is of course also associated with other diseases ranging from Hantavirus to plague.
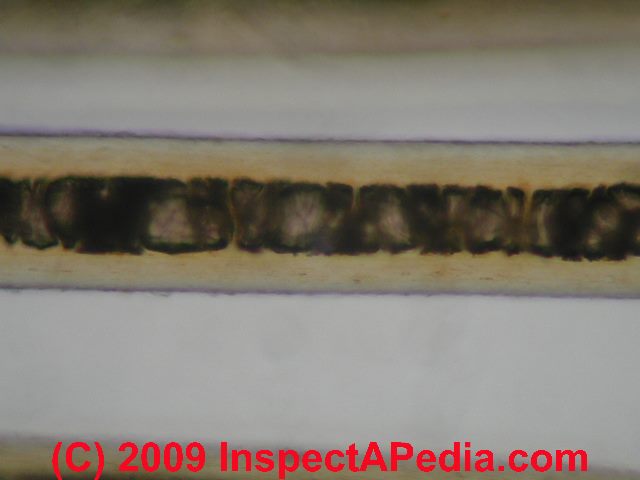
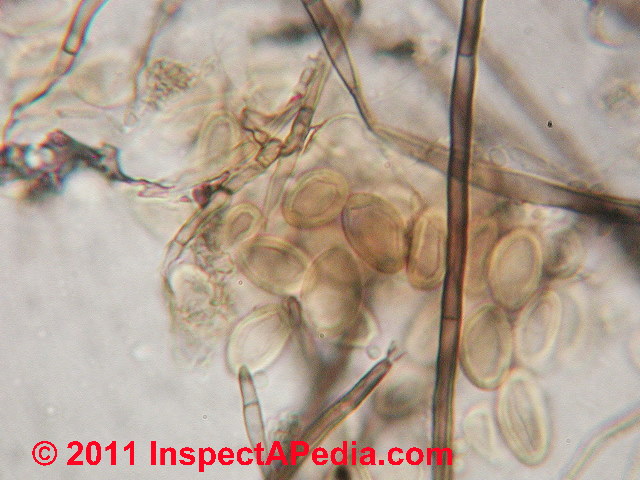
The dust mite fecals in our photo at below left along with the background of this picture give important building diagnostics.
The fecal pellets themselves are comprised largely of mold spores, and in the background (not in focus) are spore chains that are most likely Aspergillus sp. or Penicillium sp.
While it is normal to find mold spores in both outdoor and indoor air (“all mold is everywhere all the time – it’s just the concentration that varies” – Haines), observing mold spores that dominate the sample by frequency or even at low levels in chains is likely to indicate a mold contamination reservoir in the structure where this sample was collected.
See CONCENTRATION BURSTS of Mold Spores
Finding particle in connected chains – in this case both the fecal pellets and the Pen/Asp spores – often indicates a contemporary and nearby contaminant source. Why? Because normally in transport through air these chains are quickly broken apart into individual particles.
Watch out: We do not recommend that every building be screened for mold nor other problem particles. But when conditions warrant, further investigation is appropriate.
See MOLD / ENVIRONMENTAL EXPERT, HIRE ?
There may be other less-expected contaminants in building dust. For example, following a sewage flood or septic back-up in a building, both bacterial and viral hazards may be attached to common house dust particles.
See SEWAGE CONTAMINATION in BUILDINGS
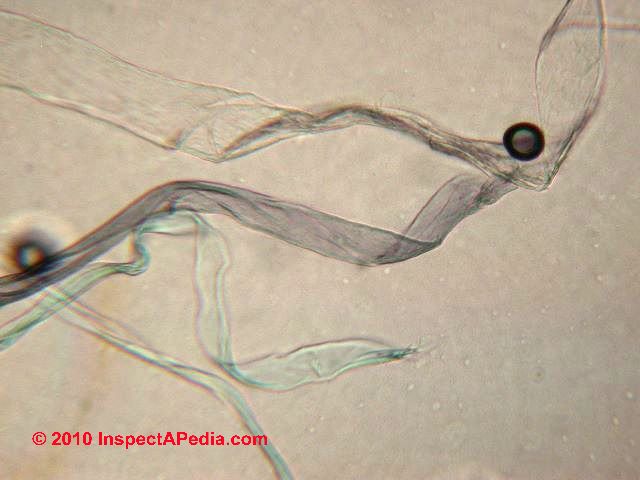
An interesting example of a surprise particle found in building dust is shown in our photo at left.
While an initial inspection did not show structural damage to the wood framed home where this sample was collected, I saw some yellowish “dust” under a kitchen sink cabinet and on nearby sills. In the lab it was quickly apparent that we were looking at spores of Meruliporia incrassata or “poria” referred to by those who prefer scarier terms as “the house eating fungus”.
We don’t normally find this particle in buildings unless there is a rot problem. Further investigation of the building floor framing and sills found extensive rot damage that had not at first been apparent. (MERULIPORIA FUNGUS DAMAGE)
And the collapse of the world trade center demonstrated (World Trade Center Collapse Dust) that in extreme conditions, for which more normal building remodeling or demolition are surely examples, dangerous levels of asbestos, lead, other metals, may be present in the building air and dust.
Separate studies, especially by industrial hygienists, document airborne dust, chemical, or gaseous hazards more common in industrial buildings & complexes both indoors and outside.
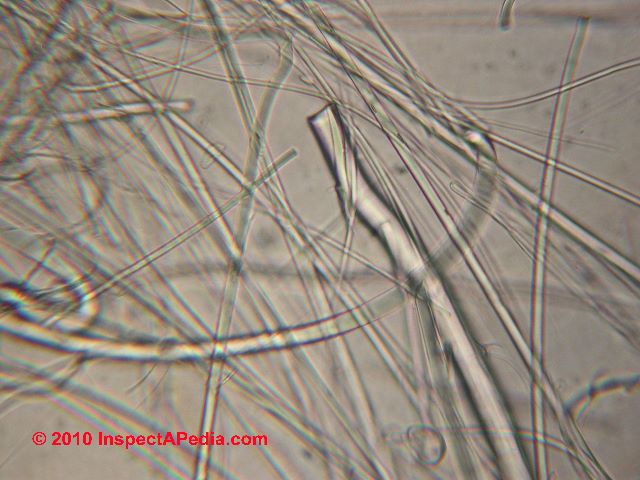
Magnified to 720x dust particle fibers found in a healthy building are primarily cotton, wool, with some linen and a synthetic fabric fibers. Depending on the presence of carpeting the fiber mix will vary according to the carpet or other furnishings.
At left and in the photo at page top we illustrate simple settled dust on indoor horizontal surfaces. For building particle screening I like settled dust samples even though simple quantitative analysis cannot be performed.
By observing what particles are dominant in such a sample and by watching out for unusual particles that still form contamination clues we can get a good idea of what particles are actually indoors. At the same time we steer clear of the serious errors that plague highly precise but grossly -inaccurate air particle testing.
See ACCURACY vs PRECISION of MEASUREMENTS and AIRBORNE MOLD COUNT VALIDITY
Watch out: While “air tests” or air sampling methods for particle collection are popular with many building investigators (quick, easy, profitable), such tests, when not accompanied by an intelligent inspection of the building exterior and interior along with a taking of building history, components, and occupant complaints, is simply not reliable, especially if results appear “negative” (FALSE NEGATIVE Results in Mold Tests).
I elaborate this opinion at AIRBORNE MOLD SPORE COUNT ACCURACY.
Chemical Contaminants in House Dust
In some buildings, potentially harmful chemicals or particles borne in, on, or attached to particles of ordinary house dust. Some of these substances include lead, arsenic, Bisphenol-A BPA , cadmium, mercury, lead, pesticides, polycyclic aromatic hydrocarbons (PAH), and others.
It is possible that even at lower absolute levels particles bearing hormone disrupting chemicals or possible carcinogens such as PBDEs are unsafe, particularly for populations at extra risk, such as pregnant women, the elderly, children (Gevao 2006), people who are immune-impaired, asthmatics.
Details about chemical, metal, and similar contaminants sometimes found in building dust are at HOUSE DUST CHEMICAL CONTAMINANTS
Fiberglass Fibers vs Fabric Fibers in House Dust
Above we show a 720x micro-photograph of white blown-in un bonded InsulSafe® building insulation sold by CertainTeed. Just below our photo shows the dominant particles in the dust sample from the home under study.
For instructions on how to collect surface dust for lab analysis, see DUST SAMPLING PROCEDURE where we also discuss finding mold in indoor dust samples. Readers concerned with fiberglass in building dust (discussed here) should also see FIBERGLASS HAZARDS.
Typically we collect dust from building surfaces using clear adhesive tape (MOLD TEST KITS) or vacuum cassettes (VACUUM CASSETTE FILTER SAMPLE).
At DUST SAMPLE TYPES we distinguish between “old house dust” and “recent house dust” which in turn can aid in building indoor air quality investigation diagnosis.
House Dust Component Studies, References, Citations
- Horak, B. “Preliminary study on the concentration and species composition of bacteria, fungi and mites in samples of house dust from Silesia (Poland).” Allergologia et immunopathologia 15, no. 3 (1987): 161. Abstract:
Twenty-one samples of house dust collected from dwellings situated in Upper Silesia (Poland) were subjected to bacteriological, mycological and acarological examination. Moreover, in two samples the concentration of bacterial endotoxin was estimated by the use of Limulus test. The mean concentration of bacteria in the examined samples was 2831.9 thousands cfu (colony forming units) per gram, that of fungi – 28.4 thousands cfu per gram, and that of mites – 51.5 specimens per gram. No significant correlation could be found between the numbers of these three components of house dust.Two examined samples of house dust contained high amounts of bacterial endotoxin which are comparable to the concentration of endotoxin in agricultural dusts, and could be of immunopathogenic significance. In the bacterial flora of the examined house dust samples, staphylococci prevailed in 45.9% of all isolates, streptococci (23.2%), corynebacteria (13.9%) and spore-forming bacilli (12.2%). Among fungi, the most numerous were strains of the genus Penicillium (39.4%), yeasts (29.5%) and strains of the genus Aspergillus (8.4%). Both bacteria and fungi comprise species that are known for their allergenic properties.The mite fauna of the examined samples was dominated by Dermatophagoides farinae (62.7% of all specimens) and Dermatophagoides pteronyssinus (30.4%); both species are known as important allergens of house dust.
The results hitherto obtained indicate the potential significance of all the investigated components (bacteria, fungi and mites) in causing allergy to house dust.
- Fergusson, Jack E., Eric A. Forbes, Robyn J. Schroeder, and Douglas E. Ryan. “The elemental composition and sources of house dust and street dust.” Science of the total environment 50 (1986): 217-221.
Abstract:The elemental compositions of house dust, street dust and soil have been determined for 26 elements on material collected in Christchurch, New Zealand. The elements Hf, Th, Sc, Sm, Ce, La, Mn, Na, K, V, Al and Fe may be considered to be soil-based and contribute about 45–50% to house dust and 87% to street dust. The elements which are enriched (>3 times) in the dusts relative to the levels found in local soils, are Br, Cu, Cl, Pb, Zn, Cr, Ca, Co, As and Sb in house dust, and Zn, Cr, Cu and Pb in street dust. - Hwang, Hyun-Min, Eun-Kee Park, Thomas M. Young, and Bruce D. Hammock. “Occurrence of endocrine-disrupting chemicals in indoor dust.” Science of the Total Environment 404, no. 1 (2008): 26-35. Abstract Excerpt:Human exposure to indoor dust enriched with endocrine-disrupting chemicals released from numerous indoor sources has been a focus of increasing concern. Longer residence times and elevated contaminant concentrations in the indoor environment may increase chances of exposure to these contaminants by 1000-fold compared to outdoor exposure.
To investigate the occurrence of semi-volatile endocrine-disrupting chemicals, including PBDEs (polybrominated diphenyl ethers), PCBs (polychlorinated biphenyls), phthalates, pyrethroids, DDT (dichlorodiphenyltrichloroethane) and its metabolites, and chlordanes, indoor dust samples were collected from household vacuum cleaner bags provided by 10 apartments and 1 community hall in Davis, California, USA. Chemical analyses show that all indoor dust samples are highly contaminated by target analytes measured in the present study.
- Jones-Otazo, Heather A., John P. Clarke, Miriam L. Diamond, Josephine A. Archbold, Glenn Ferguson, Tom Harner, G. Mark Richardson, John Jake Ryan, and Bryony Wilford. “Is house dust the missing exposure pathway for PBDEs? An analysis of the urban fate and human exposure to PBDEs.” Environmental science & technology 39, no. 14 (2005): 5121-5130.
- Meeker, John D., and Heather M. Stapleton. “House dust concentrations of organophosphate flame retardants in relation to hormone levels and semen quality parameters.” Environmental health perspectives 118, no. 3 (2010): 318.
- Maertens, Rebecca M., Jennifer Bailey, and Paul A. White. “The mutagenic hazards of settled house dust: a review.” Mutation Research/Reviews in Mutation Research 567, no. 2 (2004): 401-425. Abstract Excerpt:Given the large proportion of time people spend indoors, the potential health risks posed by chemical contaminants in the indoor environment are of concern. Research suggests that settled house dust (SHD) may be a significant source for indoor exposure to hazardous substances including polycyclic aromatic hydrocarbons (PAHs). Here, we summarize the literature on the mutagenic hazards of SHD and the presence of PAHs in dust.
- Mølhave, L., T. Schneider, S. K. Kjaergaard, L. Larsen, Svend Norn, and O. Jørgensen. “House dust in seven Danish offices.” Atmospheric Environment 34, no. 28 (2000): 4767-4779. Abstract:Floor dust from Danish offices was collected and analyzed. The dust was to be used in an exposure experiment. The dust was analyzed to show the composition of the dust which can be a source of airborne dust indoors. About 11 kg of dust from vacuum cleaner bags from seven Danish office buildings with about 1047 occupants (12 751 m2) was processed according to a standardized procedure yielding 5.5 kg of processed bulk dust. The bulk dust contained 130.000–160.000 CFU g−1 microorganisms and 71.000–90.000 CFU g−1 microfungi. The content of culturable microfungi was 65–123 CFU 30 g−1 dust. The content of endotoxins ranged from 5.06–7.24 EU g−1 (1.45 ng g−1 to 1.01 ng g−1).
Allergens (ng g−1) were from 147–159 (Mite), 395–746 (dog) and 103–330 (cat). The macro molecular organic compounds (the MOD-content) varied from 7.8–9.8 mg g−1. The threshold of release of histamine from basophil leukocytes provoked by the bulk dust was between 0.3 and 1.0 mg ml−1. The water content was 2% (WGT) and the organic fraction 33%. 6.5–5.9% (dry) was water soluble. The fiber content was less than 0.2–1.5% (WGT) and the desorbable VOCs was 176–319 μg g−1. Most of the VOC were aldehydes. However, softeners for plastic (DBP and DEHP) were present. The chemical composition includes human and animal skin fragments, paper fibers, glass wool, wood and textilefibers and inorganic and metal particles. The sizes ranged from 0.001–1 mm and the average specific density was 1.0 g m−3. The bulk dust was resuspended and injected into an exposure chamber.
The airborne dust was sampled and analyzed to illustrate the exposures that can result from sedimented dirt and dust. The airborne dust resulting from the bulk dust reached concentrations ranging from 0.26–0.75 mg m−3 in average contained 300–170 CFU m−3. The organic fraction was from 55–70% and the water content about 2.5% (WGT). The content of the dust was compared to the similar results reported in the literature and its toxic potency is estimated to be relatively low. The storage of the bulk dust during the experiment had little effect on the specific biological and chemical composition.
- Butte, Werner, and Birger Heinzow. “Pollutants in house dust as indicators of indoor contamination.” Reviews of environmental contamination and toxicology 175 (2002): 1-46.
This paper classifies indoor organic pollutants into:- VVOCs – very volatile organic compounds (Examples: Carbon monoxide, carbon dioxide, formaldehyde)
- VOCs – volatile organic compounds (Examples: solvents, aliphatic and aromatic hydrocarbons)
- SVOCS – semi-volatile organic compounds (Examples: pesticides, chlordane, chlorpyrifos, lindane, pentachlorphenol, plasticizers, pthalates)
- POM – particulate organic matter (discussed in our article HOUSE DUST COMPONENTS) though strangely the authors give just “pesticides, polycyclic organic hydrocarbons” as an example.
- Post, S., M. C. Nawijn, T. L. Hackett, M. Baranowska, R. Gras, A. J. M. van Oosterhout, and I. H. Heijink. “The composition of house dust mite is critical for mucosal barrier dysfunction and allergic sensitisation.” Thorax 67, no. 6 (2012): 488-495. Abstract:Background House dust mite (HDM) allergens have been reported to increase airway epithelial permeability, thereby facilitating access of allergens and allergic sensitisation.
Objectives The authors aimed to understand which biochemical properties of HDM are critical for epithelial immune and barrier responses as well as T helper 2-driven experimental asthma in vivo.
Methods Three commercially available HDM extracts were analysed for endotoxin levels, protease and chitinase activities and effects on transepithelial resistance, junctional proteins and pro-inflammatory cytokine release in the bronchial epithelial cell line 16HBE and normal human bronchial cells.Furthermore, the effects on epithelial remodelling and airway inflammation were investigated in a mouse model.
Results
The different HDM extracts varied extensively in their biochemical properties and induced divergent responses in vitro and in vivo. Importantly, the Greer extract, with the lowest serine protease activity, induced the most pronounced effects on epithelial barrier function and CCL20 release in vitro. In vivo, this extract induced the most profound epithelial E-cadherin delocalisation and increase in CCL20, CCL17 and interleukin 5 levels, accompanied by the most pronounced induction of HDM-specific IgE, goblet cell hyperplasia, eosinophilic inflammation and airway hyper-reactivity.
Conclusions
This study shows the ability of HDM extracts to alter epithelial immune and barrier responses is related to allergic sensitisation but independent of serine/cysteine protease activity.
- Stapleton, Heather M., Nathan G. Dodder, John H. Offenberg, Michele M. Schantz, and Stephen A. Wise. “Polybrominated diphenyl ethers in house dust and clothes dryer lint.” Environmental science & technology 39, no. 4 (2005): 925-931. Abstract: see HOUSE DUST CHEMICAL CONTAMINANTS
- HOUSE DUST PARTICLE PHOTOS – photographic study illustrating the chief constituents of vaccumed-up dust from a London Home built in 1967 and sampled in 2013. This informal article provides a general description of the contents of house dust vacuumed from a london council house built in 1967. Technical review is incomplete.
Common toxins, pathogens, or allergens in house dust.
- Chapman, Martin D., Peter W. Heymann, Susan R. Wilkins, Martha J. Brown, and Thomas AE Platts-Mills. “Monoclonal immunoassay for major dust mite ( Dermatophageides) allergens, Der p I and Der f I, and quantitative analysis of the allergen content of mite and house dust extracts.” Journal of allergy and clinical immunology 80, no. 2 (1987): 184-194. Abstract:Monoclonal, two-site radioimmunoassays (RIAs) were developed to measure allergen Derp I of Dermatophagoides pteronyssinus or Derf I of D. farinae. Microtiter plates coated with monoclonal antibody (Mab) were incubated with mite extract, and bound allergen was detected with a second 125I-labeled Mab of different epitope specificity.
The Mab RIAs were very sensitive (nanogram range) and highly specific. D. pteronyssinus extracts with different concentrations of Derp I demonstrated parallel binding curves, whereas a potent D. farinae extract demonstrated <5% of the Derp I binding in the same assay.
Similar parallel curves were obtained with several D. farinae extracts in the Derf I assay, whereas D. pteronyssinus extract demonstrated little or no binding. The Mab RIAs were compared with an inhibition RIA that measured cross-reacting determinants on both Derp I and Derf I (antigen P1 equivalent [AgP1Eq].)
The results demonstrated good quantitative agreement between these assays in commercial mite and house dust extracts (mean difference 1.57 ± 0.5-fold). Thirty house dust samples with known mite counts, Derp I, and AgP1Eq content were also compared.
The summed Mab RIA values for Derp I and Derf I demonstrated a very good correlation with AgP1Eq values (r = 0.86; p < 0.001) and with assessments of total mite-allergen content by RAST inhibition (n = 21, r = 0.77; p < 0.001). Furthermore, in samples with more than 10 mites per 100 mg of dust, the Derp I:Derf I ratio closely correlated with the ratio of the two mites counted by microscopy (n = 15, r = 0.89; p < 0.001).
The Mab RIAs can measure allergen levels in mite or dust extracts without the need for purified allergen or affinity-purified antibodies and can readily be standardized.
These assays will be useful in epidemiologic studies of allergic asthma, to assess patients’ exposure to mite allergens, and the effects of avoidance regimens. Because of the long-term stability and reproducibility of the reagents, Mab-based assays for specific allergens will also play an important role in the standardization of mite and other allergen extracts.
- Colt, Joanne S. “Comparison of pesticides and other compounds in carpet dust samples collected from used vacuum cleaner bags and from a high-volume surface sampler.” Environmental health perspectives 106, no. 11 (1998): 721. Abstract:Epidemiologic studies of the association between residential pesticide use and cancer risk require an assessment of past pesticide exposures. Pesticide levels in carpet dust are believed to reflect long-term pesticide use. Recent epidemiologic studies have found collection of dust samples using the high-volume surface sampler (HVS3) to be expensive and cumbersome.
We compared the levels of pesticides and other compounds in dust obtained from subjects’ personal used vacuum cleaner bags to that collected by the HVS3 to see if this simpler method could replace the HVS3 in epidemiologic research. We visited the homes of 15 subjects, took the used bags from their vacuums, and collected carpet dust samples with the HVS3.
The samples were analyzed for 42 target compounds: 26 pesticides, 10 polycyclic aromatic hydrocarbons (PAHs), and six polychlorinated biphenyl (PCB) congeners using GC/MS in selected ion monitoring mode. The two methods agreed in detecting the presence of the target compounds between 80% and 100% of the time.
Neither sampling method was consistently more sensitive. The median target compound concentrations were similar, and a paired t-test showed no significant differences. For many compounds, the concentrations of compounds in the HVS3 samples were higher than those in the used bag samples at the upper end of the concentration ranges.
However, the Spearman rank correlation coefficients were 0.85 or higher for most compounds, indicating that homes would be ranked similarly using both methods. Overall, there appears to be no clear difference in the quality of the pesticide, PAH, or PCB concentration data for the two dust collection methods.
- Dilworth, R. J., K. Y. Chua, and W. R. Thomas. “Sequence analysis of cDNA coding for a major house dust mite allergen, Der f I.” Clinical & Experimental Allergy 21, no. 1 (1991): 25-32.
- Dybendal, T., W. C. Wedberg, and S. Elsayed. “Dust from carpeted and smooth floors: IV. Solid material, proteins and allergens collected in the different filter stages of vacuum cleaners after ten days of use in schools.” Allergy 46, no. 6 (1991): 427-435. Abstract:
The accumulation of dust, proteins and allergens from alder, birch, timothy, cat, dog, mite, hen egg white, codfish and mould in schools was investigated by analysing the content of vacuum cleaners after 10 days of use.The main goals were to compare the dust accumulation on carpeted and smooth floors and to estimate to what degree the three vacuum cleaner filter stages (i.e. the disposable bag, the main filter and the microfilter) collected dust, proteins and allergens. Carpeted floors accumulated more dust, proteins and allergens per unit area than smooth floors.Histamine release studies of some of the dust extracts showed that the dust from carpeted floors released histamine from passively sensitized basophils at concentrations for which dust from smooth floors gave low or no histamine release. The analyses showed that most of the dust, proteins and allergens were retained in the dust bags. Less than 1% of the vacuumed material had accumulated in the main filters, which, according to the manufacturer, detain 99.5% of particles >2 μm. By the use of a scanning electron microscope (SEM), particle deposits were observed in the microfilters.
These deposits, which represented <0.1% of the total mass, showed no significant allergenic activity. Thus, for the field conditions of this study, the microfilters were not needed for cleaning the exit air of allergens, although they were useful for removing fine (<2 μm) particles.
- Dybendal, T., and S. Elsayed. “Dust from carpeted and smooth floors. V. Cat (Fel d I) and mite (Der p I and Der f I) allergen levels in school dust. Demonstration of the basophil histamine release induced by dust from classrooms.” Clinical & Experimental Allergy 22, no. 12 (1992): 1100-1106.
- Knibbs, Luke D., Congrong He, Caroline Duchaine, and Lidia Morawska. “Vacuum cleaner emissions as a source of indoor exposure to airborne particles and bacteria.” Environmental science & technology 46, no. 1 (2011): 534-542.
- Korpi, A., A-L. Pasanen, P. Pasanen, and P. Kalliokoski. “Microbial growth and metabolism in house dust.” International biodeterioration & biodegradation 40, no. 1 (1997): 19-27. Abstract:Microbial growth and production of carbon dioxide (CO2) and microbial volatile organic compounds (MVOC) were investigated in house dust. According to CO2 measurements, the metabolic activity increased after 11 days at 84–86% air relative humidity (RH) and after 3 days at 96–98% RH. Within 25 days, the concentration of fungal spores in house dust increased to about 45-fold at 84–86% RH resulting mainly from the growth of Aspergillus, Eurotium and Penicillium. At 96–98% RH, the proliferations were on average 1370- and 240-fold for fungi and bacteria, respectively.
The dominating fungal genera were Aspergillus and Penicillium. The MVOC composition revealed that microbes can utilize, for example, fatty acids and possibly aldehydes as carbon source resulting in the production of MVOC such as methyl ketones and alcohols. The main MVOC produced by microbes in house dust were 2-pentanone, 2-hexanone, 2-heptanone, limonene, 2-methylfuran, formaldehyde, acrolein and nonanal.
Also, 3-octanone, 2-ethyl-1-hexanol, 1-octen-3-ol, 3-methyl-1-butanol, 3-methyl-2-butanol, camphene and α-pinene can be considered to derive from microbial metabolism to some extent.
- Lewis, Robert G., Christopher R. Fortune, Robert D. Willis, David E. Camann, and Jeffrey T. Antley. “Distribution of pesticides and polycyclic aromatic hydrocarbons in house dust as a function of particle size.” Environmental health perspectives 107, no. 9 (1999): 721 Abstract:House dust is a repository for environmental pollutants that may accumulate indoors from both internal and external sources over long periods of time. Dust and tracked-in soil accumulate most efficiently in carpets, and the pollutants associated with dust and soil may present an exposure risk to infants and toddlers, who spend significant portions of their time in contact with or in close proximity to the floor and who engage in frequent mouthing activities.
The availability of carpet dust for exposure by transfer to the skin or by suspension into the air depends on particle size. In this study, a large sample of residential house dust was obtained from a commercial cleaning service whose clients were homeowners residing in the Raleigh-Durham-Chapel Hill (Research Triangle) area of North Carolina.|
The composite dust was separated into seven size fractions ranging from < 4 to 500 microm in diameter, and each fraction was analyzed for 28 pesticides and 10 polycyclic aromatic hydrocarbons (PAHs). Over 20% of the fractionated dust sample consisted of particles < 25 microm in diameter.
Fourteen pesticides and all 10 of the target PAHs were detected in one or more of the seven size-fractionated samples. Sample concentrations reported range from 0.02 to 22 microg/g; the synthetic pyrethroids cis- and trans-permethrin were the most abundant pesticide residue.
The concentrations of nearly all of the target analytes increased gradually with decreasing particle size for the larger particles, then increased dramatically for the two smallest particle sizes (4-25 microm and < 4 microm).
- Lioy, Paul J., Thomas Wainman, Junfeng Zhang, and Susan Goldsmith. “Typical household vacuum cleaners: the collection efficiency and emissions characteristics for fine particles.” Journal of the Air & Waste Management Association 49, no. 2 (1999): 200-206 Abstract:The issue of fine particle (PM25) exposures and their potential health effects is a focus of scientific research because of the recently promulgated National Ambient Air Quality Standard for PM2 5. Before final implementation, the health and exposure basis for the standard will be reviewed by the U.S. Environmental Protection Agency within the next five years. As part of this process, it is necessary to understand total particle exposure issues and to determine the relative importance of the origin of PM2 5 exposure in various micro-environments. The results presented in this study examine emissions of fine particles from a previously uncharacterized indoor source: the residential vacuum cleaner.
Eleven standard vacuum cleaners were tested for the emission rate of fine particles by their individual motors and for their efficiency in collecting laboratory-generated fine particles. An aerosol generator was used to introduce fine potassium chloride (KC1) particles into the vacuum cleaner inlet for the collection efficiency tests. Measurements of the motor emissions, which include carbon, and the KCl aerosol were made using a continuous HIAC/Royco 5130A light-scattering particle detector.
All tests were conducted in a metal chamber specifically designed to completely contain the vacuum cleaner and operate it in a stationary position. For the tested vacuum cleaners, fine particle motor emissions ranged from 9.6 x 10⁴ to 3.34 x 10⁸ particles/min, which were estimated to be 0.028 to 176 mg/min for mass emissions, respectively. The vast majority of particles released were in the range of 0.3-0.5 mm in diameter.
The lowest particle emission rate was obtained for a vacuum cleaner that had a high efficiency (HEPA) filter placed after the vacuum cleaner bag and the motor within a sealed exhaust system. This vacuum cleaner removed the KC1particles that escaped the vacuum cleaner bag and the particles emitted by the motor. Results obtained for the KC1 collection efficiency tests show >99% of the fine particles were captured by the two vacuum cleaners that used a HEPA filter.
A series of tests conducted on two vacuum cleaners found that the motors also emitted ultra-fine particles above 0.01 mm in diameter at rates of greater than 108 ultra-fine particles/CF of air. The model that had the best collection efficiency for fine particles also reduced the ultra-fine particle emissions by a factor of 1 x 10³.
- Luczynska, Christina M., Yin Li, Martin D. Chapman, and Thomas AE Platts-Mills. “Airborne concentrations and particle size distribution of allergen derived from domestic cats (Felis domesticus).” Am Rev Respir Dis 141, no. 361 (1990): 7. Abstract:The recent development of a sensitive two-site monoclonal antibody immunoassay for the major cat allergen (Fel d I) has made it possible to make accurate measurements of airborne cat allergen using low volume samplers that do not disturb the room. Houses with cats had from 2 to 20 ng Fel d I/m3 air compared with < 0.2 ng/m3 in houses without cats.
Using a cascade impactor and a multistage liquid impinger, the particle size distribution of airborne Fel d I in nine houses was 75% on particles ⩾ 5 µm in diameter and 25% (range, 10 to 62%) on particles ⩽ 2.5 µm. In a cat vivarium with 12 cats, the air contained 40 ng Fel d I/m3, but < 2% was detected on particles ⩽ 2.5 µm.
The air exchange rate in the vivarium (∼ 15 changes/h) appears to be the major difference from domestic houses (< 0.5 changes/h). Repeated studies in one house confirmed a very high proportion (∼ 60%) of Fel d I on small particles. During domestic cleaning, the levels of small particle allergen in this house approached those produced by a nebulizer for bronchial provocation, i.e., 40 ng/m3.
These results show unequivocally that significant airborne Fel d I is associated with small particles, which remain airborne for long periods. These findings are strikingly different from previous results obtained with airborne dust mite allergen.
The results provide an explanation for the distinctive rapid onset of asthma or rhinitis in patients allergic to cats and a basis for designing a policy to reduce airborne allergen in houses with cats.
- Pakarinen, Jaakko, Anne Hyvärinen, Mirja Salkinoja‐Salonen, Sirpa Laitinen, Aino Nevalainen, Mika J. Mäkelä, Tari Haahtela, and Leena Von Hertzen. “Predominance of Gram‐positive bacteria in house dust in the low‐allergy risk Russian Karelia.” Environmental microbiology 10, no. 12 (2008): 3317-3325. Summary:Simple living conditions and farming environment have been associated with reduced risk for allergic diseases such as atopy and asthma but the factors responsible for this effect remain unresolved. We examined the bacterial composition of house dusts obtained from Finnish and Russian Karelia, two adjacent areas with high and low occurrence of atopic diseases respectively.
Two dust mixes, both composed of 10 randomly selected dust samples from 349 Finnish and 417 Russian Karelian households were studied for bacterial biomarkers (DNA, Limulus-active endotoxin, 3-OH fatty acids, muramic acid) and for 16S rRNA gene sequences.
Overall, the DNA cloning revealed more taxons (94 different genera) of dustborne bacteria than seen in any previous study on residential environments. Majority (67%) of the bacterial DNA clones in house dust from the low-allergy Russian Kareliarepresented Gram-positive bacteria (Firmicutes and Actinobacteria), predominantly Staphylococcaceae and Corynebacteriaceae.
Russian Karelian dust showed up to 20-fold higher contents of muramic acid (marker of Gram-positive bacteria) and a sevenfold higher number of clones of animal-associated species, whereas in Finnish Karelian dust Gram-negatives (mainly Proteobacteria) predominated.
Clones of plant-associated bacterial species and of chloroplast, indicating plant biomass, were more numerous in Finnish than in Russian Karelian dust. In conclusion, this study revealed major disparities between Finnish and Russian house dusts. The higher bacterial content and the predominance of Gram-positive bacteria in Russian dust may have implications for occurrence of atopy.
- Pepys, J., Moira Chan, and F. E. Hargreave. “Mites and house-dust allergy.” The Lancet 291, no. 7555 (1968): 1270-1272.
- Maertens, Rebecca M., Jennifer Bailey, and Paul A. White. “The mutagenic hazards of settled house dust: a review.” Mutation Research/Reviews in Mutation Research 567, no. 2 (2004): 401-425. Abstract:
Given the large proportion of time people spend indoors, the potential health risks posed by chemical contaminants in the indoor environment are of concern. Research suggests that settled house dust (SHD) may be a significant source for indoor exposure to hazardous substances including polycyclic aromatic hydrocarbons (PAHs).Here, we summarize the literature on the mutagenic hazards of SHD and the presence of PAHs in dust. We assess the extent to which PAHs are estimated to contribute to the mutagenicity of SHD, and evaluate the carcinogenic risks associated with exposures to PAHs in SHD. Research demonstrates that SHD has a Salmonella TA98 mutagenic potency of 1000–7000 revertants/g, and contains between 0.5 and 500 μg/g of PAHs.Although they only account for a small proportion of the variability, analyses of pooled datasets suggest that cigarette smoking and an urban location contribute to higher levels of PAHs. Despite their presence, our calculations show that PAHs likely account for less than 25% of the overall mutagenic potency of dust.
Nevertheless, carcinogenic PAHs in dust can pose potential health risks, particularly for children who play and crawl on dusty floors, and exhibit hand-to-mouth behaviour. Risk assessment calculations performed in this study reveal that the excess cancer risks from non-dietary ingestion of carcinogenic PAHs in SHD by preschool aged children is generally in the range of what is considered acceptable (1 × 10⁻⁶ to 2 × 10⁻⁶).
Substantially elevated risk estimates in the range 1.5 × 10⁻⁴ to 2.5 × 10⁻⁴ correspond only to situations where the PAH content is at or beyond the 95th percentile, and the risk estimates are adjusted for enhanced susceptibility at early life stages. Analyses of SHD and its contaminants provide an indication of indoor pollution and present important information for human exposure assessments.
- Marklund, Anneli, Barbro Andersson, and Peter Haglund. “Screening of organophosphorus compounds and their distribution in various indoor environments.” Chemosphere 53, no. 9 (2003): 1137-1146.
- Miller, J. D., A. M. Laflamme, Y. Sobol, P. Lafontaine, and R. Greenhalgh. “Fungi and fungal products in some Canadian houses.” International Biodeterioration 24, no. 2 (1988): 103-120. Abstract:
Building related illness prompted a study in the winter of 1986 to identify and quantify and fungal products present in c. 50 Canadian homes. Of these, 70% had been reputedly associated with health problems. Building parameters, i.e. air change rate and the internal moisture levels, were measured, and the fungi present were characterized and quantified along with their metabolites.Air and dust samples were analyzed and the fungal biomass in the dust was measured by a procedure which involved determination of ergosterol by a gas chromatograph/mass spectrometer system. Some 42 fungal species were identified in air, samples of which were further analyzed for fungal volatiles.Penicillium was the most common genus in both air and dust, together with Cladosporium and Alternaria. The potentially hazardous fungus Aspergillus fumigatus was found in only two houses, and Strachybotry atra in only one. New criteria are suggested to define the acceptable standards for indoor fungal levels in air during winter.
- Moriwaki, Hiroshi, Yumiko Takata, and Ryuichi Arakawa. “Concentrations of perfluorooctane sulfonate (PFOS) and perfluorooctanoic acid (PFOA) in vacuum cleaner dust collected in Japanese homes.” Journal of Environmental Monitoring 5, no. 5 (2003): 753-757. Abstract:Perfluorooctane sulfonate (PFOS) and perfluorooctanoic acid (PFOA) are shown to be globally distributed, environmentally persistent and bioaccumulative. Although there is evidence that these compounds exist in the serum of non-occupationally exposed humans, the pathways leading to the presence of PFOS and PFOA are not well characterized.
The concentrations of PFOS and PFOA in the vacuum cleaner dust collected in Japanese homes were measured. With regard to risk management, it is important to consider the usage of PFOS and PFOA in the indoor environment in order to avoid further pollution.
- Saraf, Anita, Lennart Larsson, Harriet Burge, and Donald Milton. “Quantification of ergosterol and 3-hydroxy fatty acids in settled house dust by gas chromatography-mass spectrometry: comparison with fungal culture and determination of endotoxin by a Limulus amebocyte lysate assay.” Applied and environmental microbiology 63, no. 7 (1997): 2554-2559. Abstract:Ergosterol and 3-hydroxy fatty acids, chemical markers for fungal biomass and the endotoxin of gram-negative bacteria, respectively, may be useful in studies of health effects of organic dusts, including domestic house dust. This paper reports a method for the combined determination of ergosterol and 3-hydroxy fatty acids in a single dust sample and a comparison of these chemical biomarkers determined by gas chromatography-mass spectrometry with results from fungal culture and Limulus assay.
Analyses of replicate house dust samples resulted in correlations of 0.91 (ergosterol in six replicates; P lt 0.01) and 0.94 (3-hydroxy fatty acids in nine replicates; P lt 0.001). The amounts of ergosterol (range, 2 to 16.5 ng/mg of dust) correlated with those of total culturable fungi (range, 6 to 1,400 CFU/mg of dust) in 17 samples, (r = 0.65; P lt 0.005).
The amounts of endotoxin (range, 11 to 243 endotoxin units/mg of dust) measured with a modified chromogenic Limulus assay correlated with those of lipopolysaccharide (LPS) determined from 3-hydroxy fatty acid analysis of 15 samples. The correlation coefficient depended on the chain lengths of 3-hydroxy acids used to compute the LPS content.
The correlation was high (r = 0.88 +- 0.01; P lt 0.001) when fatty acid chains of 10 to 14 carbon atoms were included; the correlation was much lower when hydroxy acids of 16- or 18-carbon chains were included. In conclusion, the results of the described extraction and analysis procedure for ergosterol and 3-hydroxy fatty acids are reproducible, and the results can be correlated with fungal culture and endotoxin activity of organic dust samples.
- Wharton, Go W. “House dust mites.” Journal of Medical Entomology 12, no. 6 (1976): 577-621. Abstract:The most common mites found in the contents of vacuum cleaner sweepings are members of a family of Acaridei, the Pyroglyphidae. Techniques for collecting them effectively were first described in 1964. Since that time, systems for extracting mites from vacuumed dust using sieves and flotation or sedimentation have been improved.
The species found in homes are readily cultured. Successful methods utilize high protein foods, an area-enlarging substrate, 25°C and a humidity in equilibrium with saturated NaCl (aw = 0.75, rh = 75%). Development from egg through larva, protonymph, tritonymph to adult requires about a month in cultures under optimum conditions. Pyroglyphids have the reduced setation of parasitic Acaridei but most live as nidicoles.
There are 35 species now recognized and 12 of these are associated with man. Dermatophagoides pteronyssinus, D. farinae and Euroglyphus maynei most common on a world basis but other species are significant in some areas, such as Hirstia domicola in Japan.
Both D. farinae and D. pteronyssinus have facultative quiescent protonymphs that can survive harsh conditions. These species have a critical equilibrium activity (CEA) below 0.75 and thus can maintain their water content as long as they have access to air as humid as 75% rh during at least part of the time. The favored site for the association of these mites with man is his bed. Populations maintain themselves in beds on a continuing basis.
When temperatures and humidities are favorable, these mites also develop in other areas of the house. Their association with man is significant because they either produce or concentrate allergens that are responsible for house dust allergy, which is prevalent on a global basis. In the U. S. it is estimated that 4% of the population is involved.
Both mites and house dust can be held at low levels by use of non-fibrous materials and frequent vacuuming. These measures alleviate suffering from house dust allergy. In persistent cases, extracts of house dust or house dust mites have been used in desensitizing patients.
House dust mites seem to be resistant to most pesticides, but they are susceptible to low concentrations of lindane.
- Woodfolk, Judith A., Christina M. Luczynska, Frederic de Blay, Martin D. Chapman, and Thomas AE Platts-Mills. “The effect of vacuum cleaners on the concentration and particle size distribution of airborne cat allergen.” Journal of allergy and clinical immunology 91, no. 4 (1993): 829-837. Abstract:Background: Vacuum cleaners are essential for the removal of dust from the surface of carpets; however, they may also contribute to airborne dust both by leakage through the cleaner and disturbance of floor dust.
Methods: The present studies used established techniques for measuring airborne Fel d I to study the effects of vacuum cleaners on airborne cat allergen under laboratory conditions and in houses with cats. Nine different models were loaded with dust containing 50 mg Fel d I and run for 15 minutes in a laboratory room (volume∼18 m3). Leakage was expressed as the airborne concentration of allergen in nanograms per cubic meter.
Results: Cleaners incorporating a double-thickness dust bag either did not leak, that is, less than 0.4 ng Fel d I/ m3 or had minor leakage∼5 ng/ m3. Vacuum cleaners with single-thickness paper bags leaked more, that is, 15 to > 90 ng/m3 with the exception of the cleaner with an efficient outer bag. Detailed studies on a vacuum cleaner that leaked showed that placing dust in the bag, replacing the dust bag with a double-thickness bag, and placing an electrostatic filter over the exhaust reduced levels from greater than 90 ng/m3 to less than 2 ng/m3.
Two water-filter vacuum cleaners each emitted cat allergen (up to > 100 ng/m3) with a mean of 90% on particles less than 2.5 μm diameter. This emission could be almost completely controlled by taping electrostatic filter paper over the air outlet.
Conclusions: In houses with cats, different models of vacuum cleaners could either reduce or increase total airborne allergen, and could also selectively increase certain particle sizes. These results suggest that cat allergen is a good model for studying the effectiveness of vacuum cleaners recommended to allergic patients.
- Li, Zheng, Philip K. Hopke, Liaquat Husain, Sumizah Qureshi, Vincent A. Dutkiewicz, James J. Schwab, Frank Drewnick, and Kenneth L. Demerjian. “Sources of fine particle composition in New York city.” Atmospheric Environment 38, no. 38 (2004): 6521-6529. Abstract:
Fine particle composition data from samples collected at Queens College during July 2001 were studied using positive matrix factorization (PMF). The sampling systems are an integrated filter sampler with a 6-h sampling time interval, an aerosol mass spectrometer (AMS) with a 10-min sampling time interval and a particle-into-liquid sampler with ion chromatography (PILS-IC) with 15-min sampling time interval. The data from the AMS and the PILS-IC were aggregated to 6-h average values for the PMF calculation.Sulfate, ammonium, and nitrate data were compared among the different instruments. The PMF method uses the estimated errors in the data to provide optimal point-by-point weighting and permits efficient treatment of missing and below detection limit values. Six source categories were resolved from the data.They are: secondary sulfate with high concentration SO42−; secondary nitrate with the presence of high concentration NO3−; motor vehicle emissions with high concentration of OC and Zn; road dust represented by Al, Ca, Fe, and K; sea salt with high concentration of Cl and Na; and oil combustion marked by the presence of Ni and V.
Article Source: https://inspectapedia.com/sickhouse/House_Dust_Composition.php

Leave a Reply